Wijmo UI for the Web
seriesStyles Option
wijmo.chart.wijchartcore Namespace > options type : seriesStyles Option

Sets an array of style objects to use in rendering the chart elements for each series in the chart.

Type: Array

Default value: []


Syntax
$(function () {
    
    // Get value
    var returnsValue; // Type:  []
    returnsValue = $(".selector").wijchartcore("option", "seriesStyles");
    
    // Set value
    var newValue; // Type:  []
    $(".selector").wijchartcore("option", "seriesStyles", newValue);
        
});
var seriesStyles : ;
Example

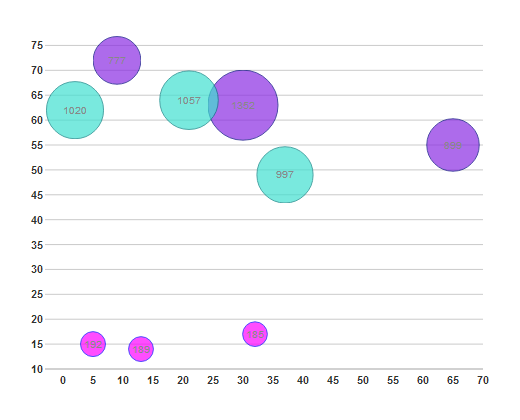
This code creates a chart with three series. Each series has a a different fill and outline color, and all three have 70% opacity so that the grid lines show through the bubbles, as in the image below.

<script type="text/javascript">
$(document).ready(function () {
    $("#wijbubblechart").wijbubblechart({
        legend: {visible: false},
        seriesList: [{
            label: "A",
            data: {x: [30, 9, 65], y: [63, 72, 55], y1: [1352, 777, 899]}
            }, {
            label: "B",
            data: {x: [21, 2, 37], y: [64, 62, 49], y1: [1057, 1020, 997]}
            }, {
            label: "C",
            data: {x: [13, 5, 32], y: [14, 15, 17], y1: [189, 192, 185]}
            }],
        seriesStyles: [
            {fill: "blueviolet", stroke: "navy", opacity: 0.7}, 
            {fill: "turquoise", stroke: "teal", opacity: 0.7}, 
            {fill: "fuchsia", stroke: "blue", opacity: 0.7}],
    });
});
</script>
Remarks

Each style object in the array applies to one series in your seriesList, so you need specify only as many style objects as you have series objects in your seriesList.

The style is also used in the legend entry for the series in your seriesList. For more infomration on available style parameters, see the Style Options topic.

See Also

Reference

options type
wijchartcore jQuery Widget