Wijmo UI for the Web
legend Option
wijmo.chart.wijchartcore Namespace > options type : legend Option

Creates a legend object to display with the chart.

Type: wijmo.chart.chart_legend object

Default:

{
    compass: "east", 
    orientation: "vertical",
    style: {fill: "#none", stroke: "none"}, 
    text: "", 
    textMargin: {left: 2, top: 2, right: 2, bottom: 2 },
    textStyle: {fill: "#333", stroke: "none"}, 
    titleStyle: {"font-weight": "bold", fill: "#000", stroke: "none"}, 
    visible: true
}
Syntax
$(function () {
    
    // Get value
    var returnsValue; // Type:  wijmo.chart.chart_legend
    returnsValue = $(".selector").wijchartcore("option", "legend");
    
    // Set value
    var newValue; // Type:  wijmo.chart.chart_legend
    $(".selector").wijchartcore("option", "legend", newValue);
        
});
var legend : chart_legend;
Example

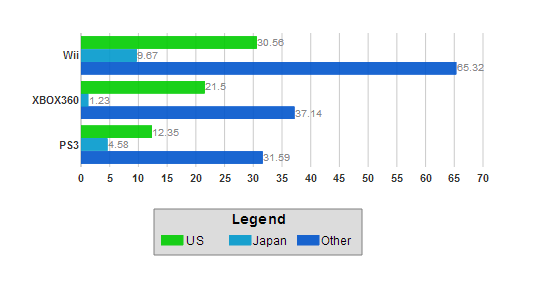
This code creates a chart with a legend that is positioned below the chart (south), with series labels and colors in a row (horizontal), a grey outline and lighter grey fill (style), has a title that reads "Legend" (text), has 5 pixels of space around the text (textMargin), has series labels in a black 12-point font (textStyle), and has a 14-point font title (titleStyle) as in the image below.

<script id="scriptInit" type="text/javascript">
    $(document).ready(function () {
        $("#wijbarchart").wijbarchart({
            legend: {
                compass: "south",
                orientation: "horizontal",
                style: {fill: "gainsboro", stroke: "grey"}, 
                text: "Legend", 
                textMargin: {left: 5, top: 5, right: 5, bottom: 5 },
                textStyle: {fill: "black", "font-size": 12}, 
                titleStyle: {"font-size": 14}
            },
            seriesList: [{
                label: "US",
                data: { 
                    x: ['PS3', 'XBOX360', 'Wii'], 
                    y: [12.35, 21.50, 30.56] 
                }
            }, 
            {
                label: "Japan",
                data: { 
                    x: ['PS3', 'XBOX360', 'Wii'], 
                    y: [4.58, 1.23, 9.67] 
                }
            }, 
            {
                label: "Other",
                data: { 
                    x: ['PS3', 'XBOX360', 'Wii'], 
                    y: [31.59, 37.14, 65.32] 
                }
            }],
        });
    });
</script>
Remarks

By default, each series that you create in the seriesList is represented by a color in the legend, using the seriesList label that you specify. If you do not specify a label, it is labeled "undefined." If you do not want a series to appear in the legend, you can set the seriesList legendEntry attribute to false.

By default, users can click a legend entry to toggle the data series it represents in the chart. See Clickable Legend for code that allows you to disable this function.

See Also

Reference

options type
wijchartcore jQuery Widget