var instance; // Type: wijmo.chart.chart_axis;
var value; // Type: chart_axis_grid
value = instance.gridMajor;
var gridMajor : chart_axis_grid;

var instance; // Type: wijmo.chart.chart_axis; var value; // Type: chart_axis_grid value = instance.gridMajor;
var gridMajor : chart_axis_grid;
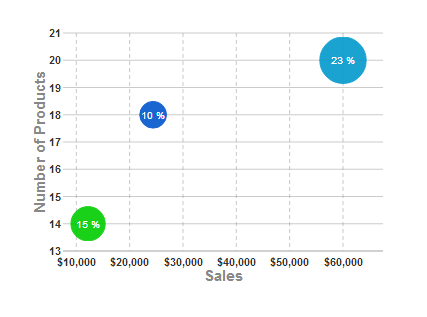
This code sets the X axis gridMajor option's visible attribute to true to display the dashed lines that appear by default. You can customize these lines using the style attribute. Just setting visible to true using this code creates a chart like the one in the picture below.

<script type="text/javascript">
$(document).ready(function () {
    $("#wijbubblechart").wijbubblechart({
        axis: {
            y: {text: "Number of Products"},
            x: {
                text: "Sales",
                annoFormatString: "C0",
                gridMajor: {visible: true}
                }
        },
        chartLabelFormatString: "p0",
        chartLabelStyle: {fill: "white"},
        legend: {visible: false},
        seriesList: [
        {
            label: "Company A Market Share",
            data: { y: [14], x: [12200], y1: [.15] }
        }, {
            label: "Company B Market Share",
            data: { y: [20], x: [60000], y1: [.23] }
        }, {
            label: "Company C Market Share",
            data: { y: [18], x: [24400], y1: [.1] }
        }]
    });
});
</script>