Wijmo UI for the Web
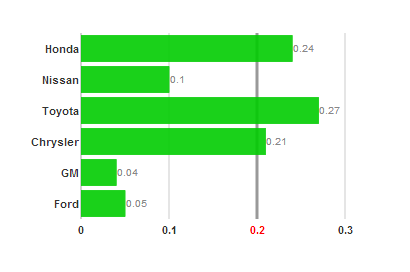
Highlight a Grid Line

Building on the Quick Start example, you can hide an axis and its labels using two attributes of the axis option.
Drop down and copy code
| Hide Axis Script |
Copy Code |
|---|---|
<script id="scriptInit" type="text/javascript">
    $(document).ready(function () {
        $("#wijbarchart").wijbarchart({
            seriesList: [{
                legendEntry: false,
                data: {
                    x: ['Ford', 'GM', 'Chrysler', 'Toyota', 'Nissan', 'Honda'],
                    y: [.05, .04, .21, .27, .1, .24]
                }
            }],
        });
         var barchart = $("#wijbarchart");
         elements = barchart.wijbarchart().data().wijbarchart.axisEles;
         $.each(elements, function (key, value) {
                 if (value.type == 'path')
                 {
                     if (key > 0) {
                         if (elements[key+1].attrs.text == 0.2) {
                             elements[key+1].attr("fill", "red");
                             value.attr("stroke-width", 3);
                         }
                     }
                 }
        });
    });
</script>
| |
