Wijmo UI for the Web
Create an Area Chart
Wijmo User Guide > Widgets > Chart Widgets > CompositeChart > CompositeChart How To > Create an Area Chart

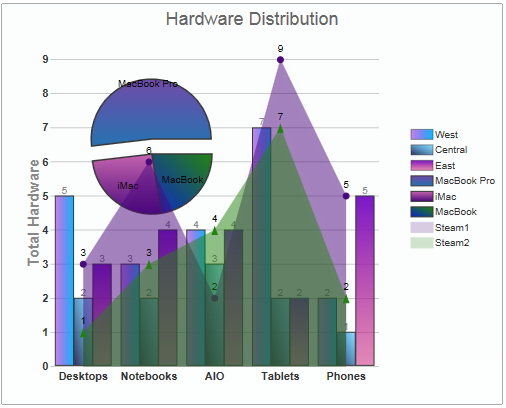
Building on the Quick Start example, you can change the line chart portion of the wijcompositechart to an area chart by changing the part of your script that specifies the "line" chart type to "area."

  1. In the <head> section of your HTML file, replace the script that includes the document ready function with this one, which initializes the widget and sets several widget options.
    • The X and Y axes are set to show title text.
    • The tooltip (hint) content is set to show data labels.
    • The header displays title text.
    • Chart types, labels, and data, (as well as radius for the pie chart and marker types for the line chart) are added to the seriesList.

    Drop down and copy code

    Show Grid Lines Script
    Copy Code
    <script id="scriptInit" type="text/javascript">
        $(document).ready(function () {
        $("#wijcompositechart").wijcompositechart({
            axis: {y: {text: "Total Hardware"}},
            hint: {
                content: function () {return this.label + '\n ' + this.y + '';}
                },
            header: {text: "Hardware Distribution"},
            seriesList: [{
                type: "column",
                label: "West",
                data: { 
                    x: ['Desktops', 'Notebooks', 'AIO', 'Tablets', 'Phones'], 
                    y: [5, 3, 4, 7, 2] }
            }, 
            {
                type: "column",
                label: "Central",
                data: { 
                    x: ['Desktops', 'Notebooks', 'AIO', 'Tablets', 'Phones'], 
                    y: [2, 2, 3, 2, 1] }
            }, 
            {
                type: "column",
                label: "East",
                data: { 
                    x: ['Desktops', 'Notebooks', 'AIO', 'Tablets', 'Phones'], 
                    y: [3, 4, 4, 2, 5] }
            }, 
            {
                type: "pie",
                center: { x: 150, y: 150 },
                radius: 60,
                data: [
                    {label: "MacBook Pro",data: 46.78}, 
                    {label: "iMac", data: 23.18}, 
                    {label: "MacBook", data: 20.25}
                    ]
            }, 
            {
                type: "area",
                label: "Steam1",
                legendEntry: true,
                data: {
                    x: ['Desktops', 'Notebooks', 'AIO', 'Tablets', 'Phones'],
                    y: [3, 6, 2, 9, 5]
                },
                markers: {visible: true, type: "circle"}
            }, 
            {
                type: "area",
                label: "Steam2",
                legendEntry: true,
                data: {
                    x: ['Desktops', 'Notebooks', 'AIO', 'Tablets', 'Phones'],
                    y: [1, 3, 4, 7, 2]
                },
                markers: {visible: true, type: "tri"}
            }]
        });
      });
    </script>
    
  2. No changes are necessary in the <body> section of your HTML file. The basic <div> tag is sufficient to create the chart.
  3. Save your HTML file and open it in a browser. The chart appears like the one in the image below.
See Also

Widgets

Reference

Concepts