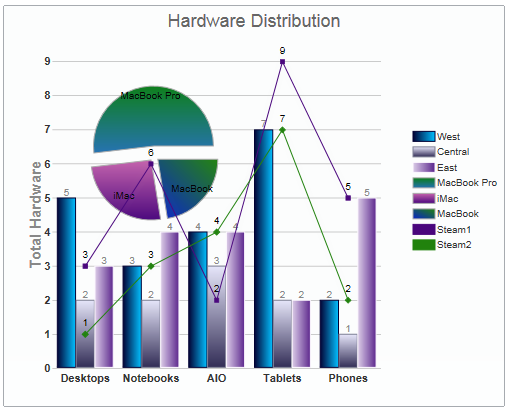

There are a number of options that allow you to change the appearance of the chart. In this example, we use the seriesStyles option to change the fill and stroke (outline) settings. Here, we use a linear color gradient for the fill property.
The following code, which you can use to replace the seriesStyles settings in the Quick Start example, changes the fill color of the bars to use a gradient (listed first) and two colors in a linear grade, and adds an outline color (stroke):
Script
| Sample Script |
Copy Code |
|---|---|
seriesStyles: [
    {fill: "180-#00BFFF-#000033", stroke: "#000033", opacity: 1},
    {fill: "90-#302B54-#E6E6FA", stroke: "#7D7F94", opacity: 1},
    {fill: "180-#5B268C-#DBCCE8", stroke: "#FDF8FF", opacity: 1},
    {fill: "270-rgb(11,125,25)-rgb(35,113,176)",
     stroke: "rgb(171,171,171)", opacity: 1},
    {fill: "90-rgb(74,6,125)-rgb(196,98,172)",
     stroke: "rgb(171,171,171)", opacity: 1},
    {fill: "45-rgb(8,34,201)-rgb(33,130,13)",
     stroke: "rgb(171,171,171)", opacity: 1},
    {fill: "#4a067d", stroke: "#4a067d", opacity: 1},
    {fill: "#21820d", stroke: "#21820d", opacity: 1}
]
| |
The new styles are applied to the charts in the same order as the legend. The first three fill attributes apply to the three column charts. The next three apply to the three sections of the pie chart. The last two apply to the two line charts. The initial number before the color code controls the gradient for the chart.
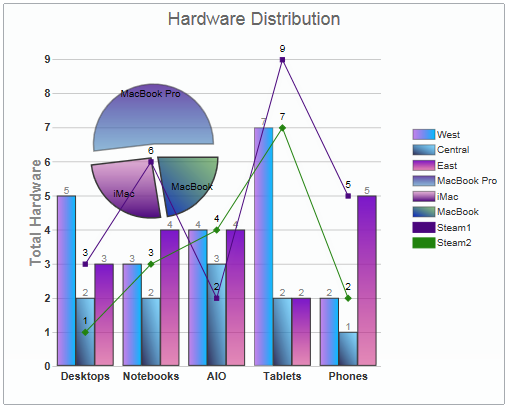
You can also change the opacity of the composite charts as in the following script:
Script
| Sample Script |
Copy Code |
|---|---|
seriesStyles: [
    {fill: "180-#00BFFF-#880FD9", stroke: "#363636", opacity: 0.5},
    {fill: "45-#302B54-#17B2FF", stroke: "#363636", opacity: 0.5},
    {fill: "270-#7814C9-#C9146F", stroke: "#363636", opacity: 0.5},
    {fill: "270-rgb(111,72,168)-rgb(35,113,176)", stroke: "rgb(54,54,54)",
     "stroke-width": "1.5", opacity: 0.5},
    {fill: "90-rgb(74,6,125)-rgb(196,98,172)", stroke: "rgb(54,54,54)",
     "stroke-width": "1.5", opacity: 0.5},
    {fill: "45-rgb(8,34,201)-rgb(33,130,13)", stroke: "rgb(54,54,54)",
     "stroke-width": "1.5", opacity: 0.5},
    {fill: "#4a067d", stroke: "#4a067d", opacity: 0.5},
    {fill: "#21820d", stroke: "#21820d", opacity: 0.5}
]
| |
Note the change in the PieChart and BarChart opacity in the following image: