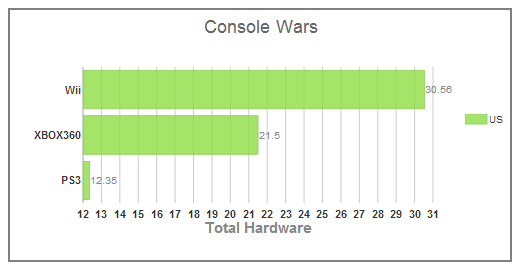
Building on the Quick Start example, you can add a border around the edge of your entire chart area. This same method applies to all Wijmo widgets.
- In the <head> section of your HTML file, there is no need to change the script to create a border around the chart area.
- In the <body> section of your HTML file, add a border to the style attribute of your <div> tag using code like the following:
Div Markup |
Copy Code |
<div id="wijbarchart" style="width: 500px; height: 250px; border: 2px solid grey"></div>
|
- Save your HTML file and open it in a browser. The chart appears like the one in the image below, with a solid, grey, two-pixel border.
See Also